Design Workshop Sessions
I set up a series of working sessions with our team and the product owners, business stakeholders, research, engineers and our design manager.
This was an opportunity for the teams to begin the conversations around this product and features needed to define our success model. Our approach as a team was to involve as many stakeholders in the
process so we were all on the same page at the onset of the project.
These 3+ hour remote workshop sessions allowed for complex discussions and the vision / functionality of the report iteself along with brand awareness or our products and service offereings
Different perspectives and insights from various teams and disciplines within these teams built some interesting conversations that we needed to work through collectively.
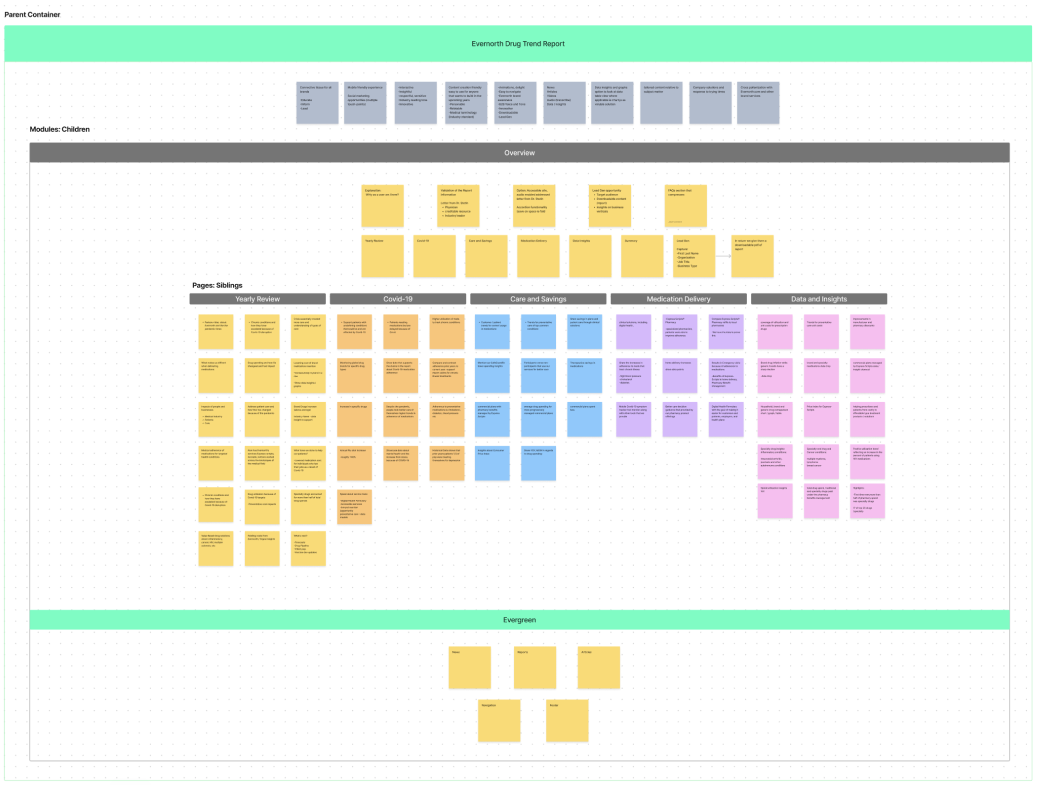
Modular approach
The first thing that I wanted the team to think about was how we can deliver something that is a long-term solution. To think beyond the request, and explore scalability for future content creation.
What does a systmatic approach look like? How can we build something that is more of a content creation tool for future requests.
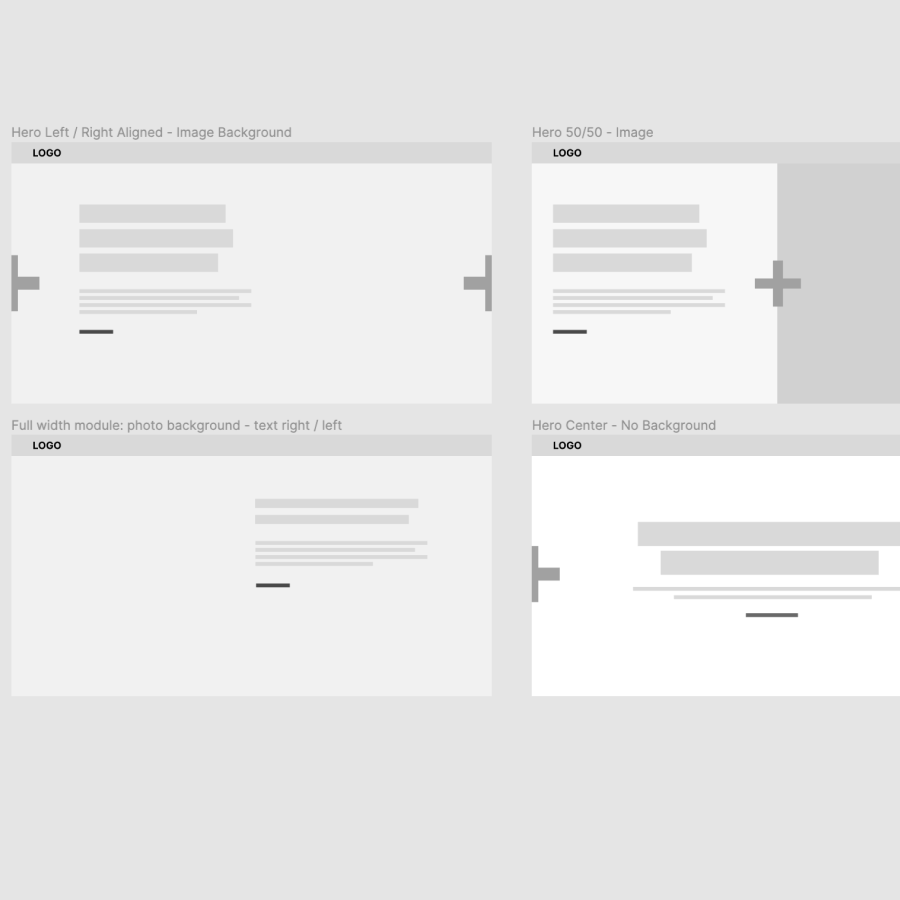
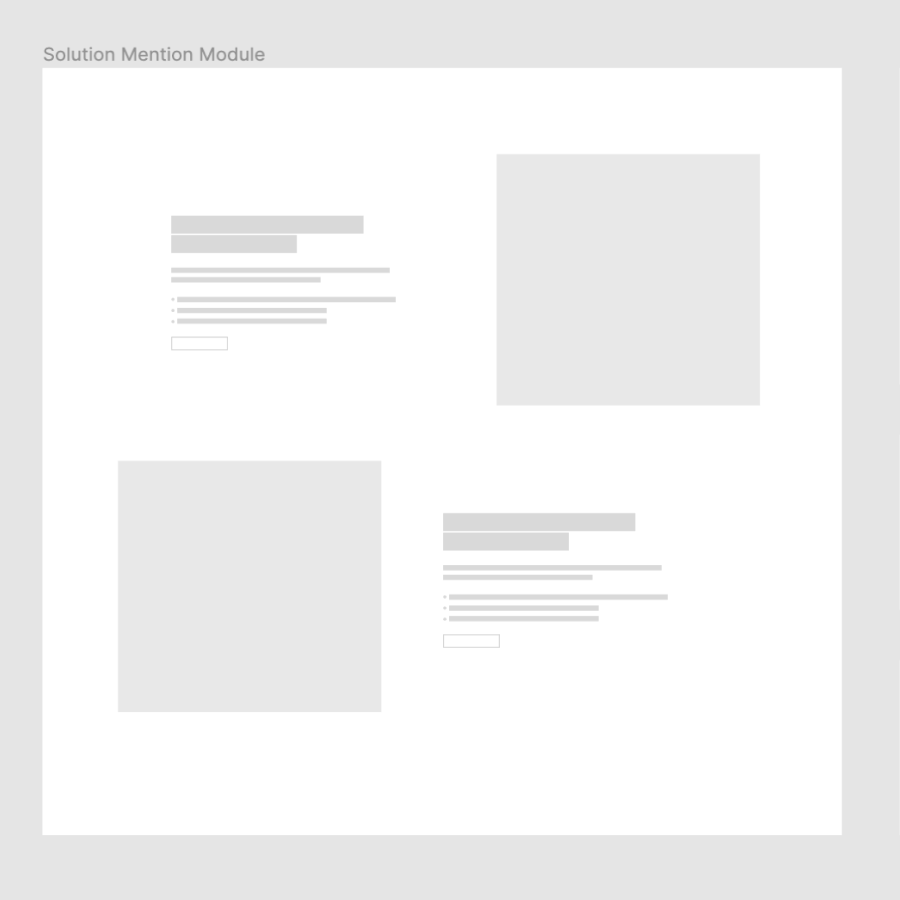
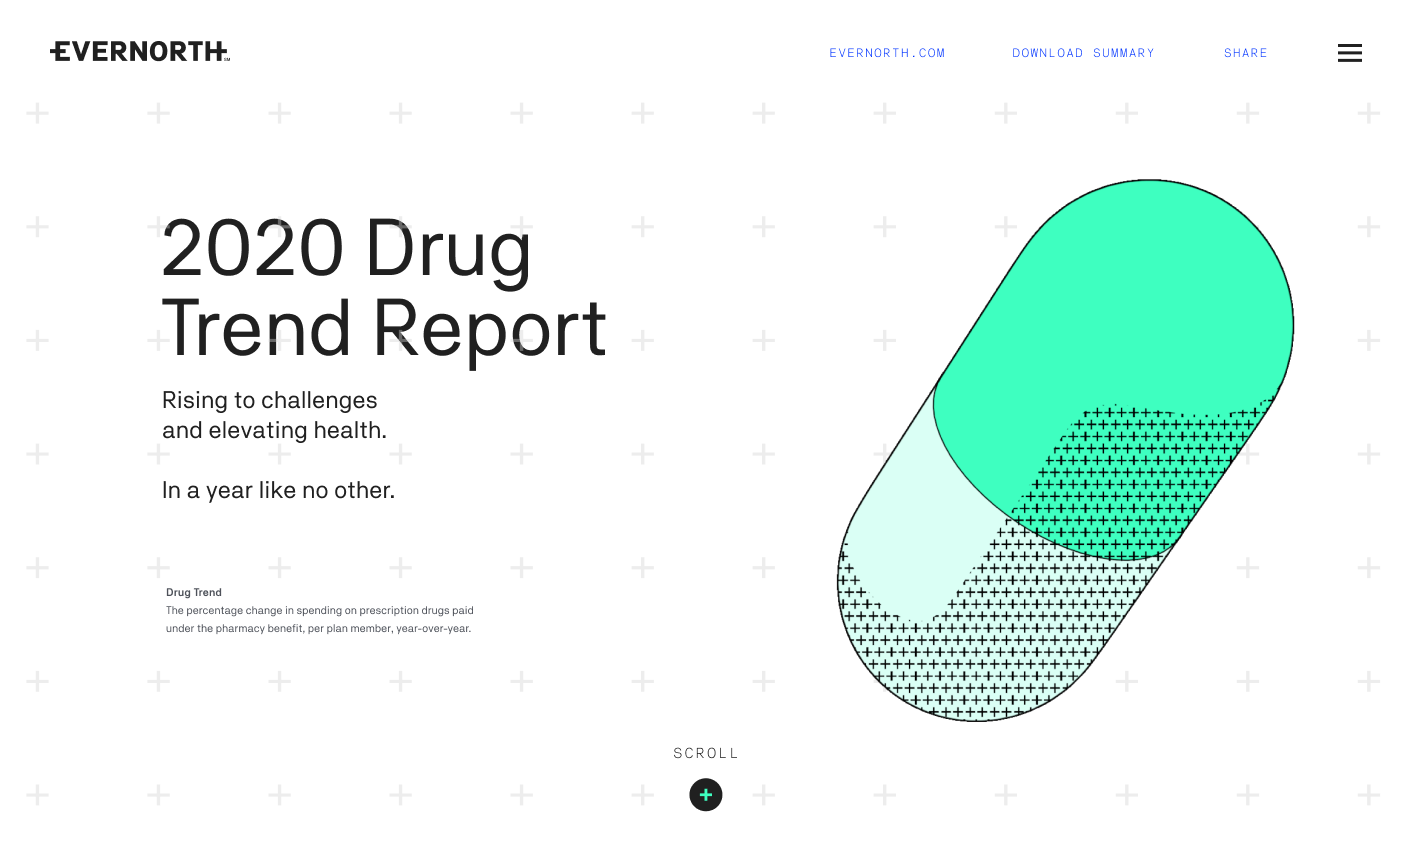
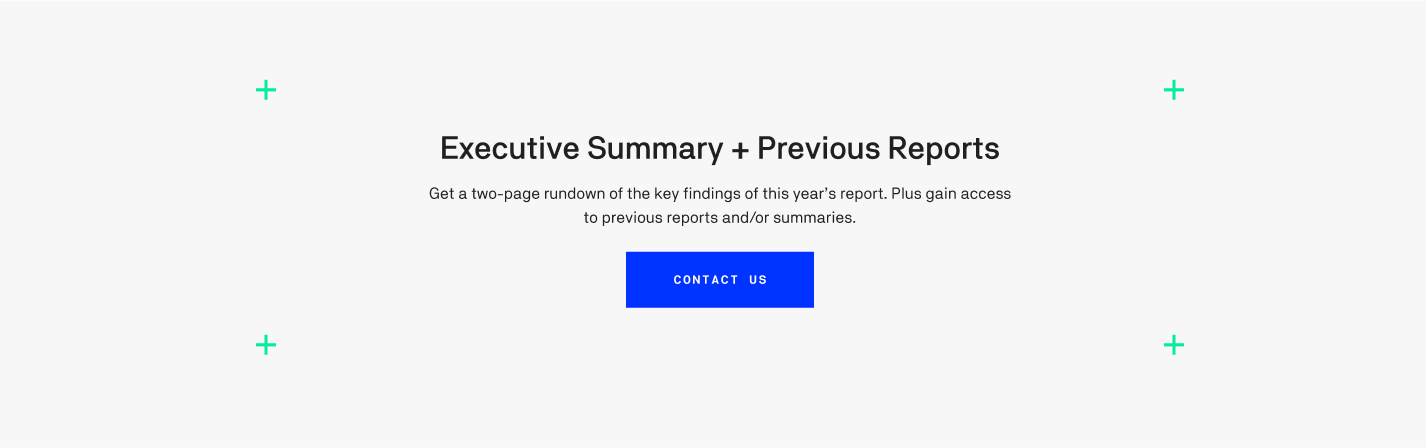
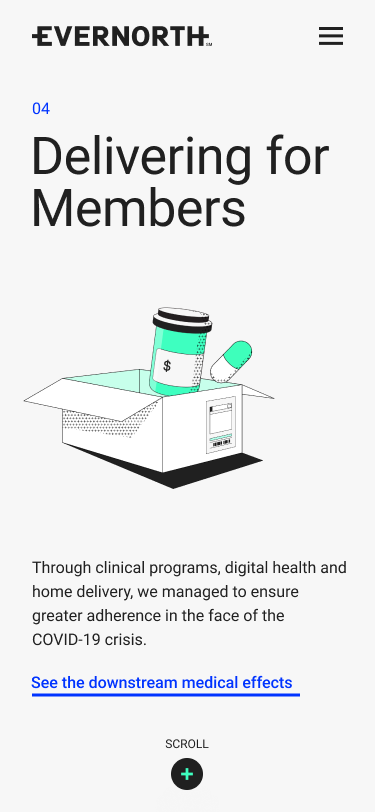
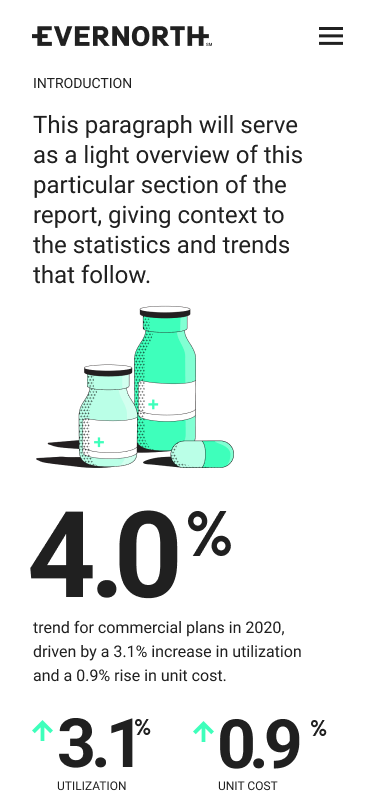
Evernorth product launch, with intuitive UI
We workerd very closely with our brand team on iconography, animations and other brand assets. This product ould be the firs tof it's kind representign Evernorth.
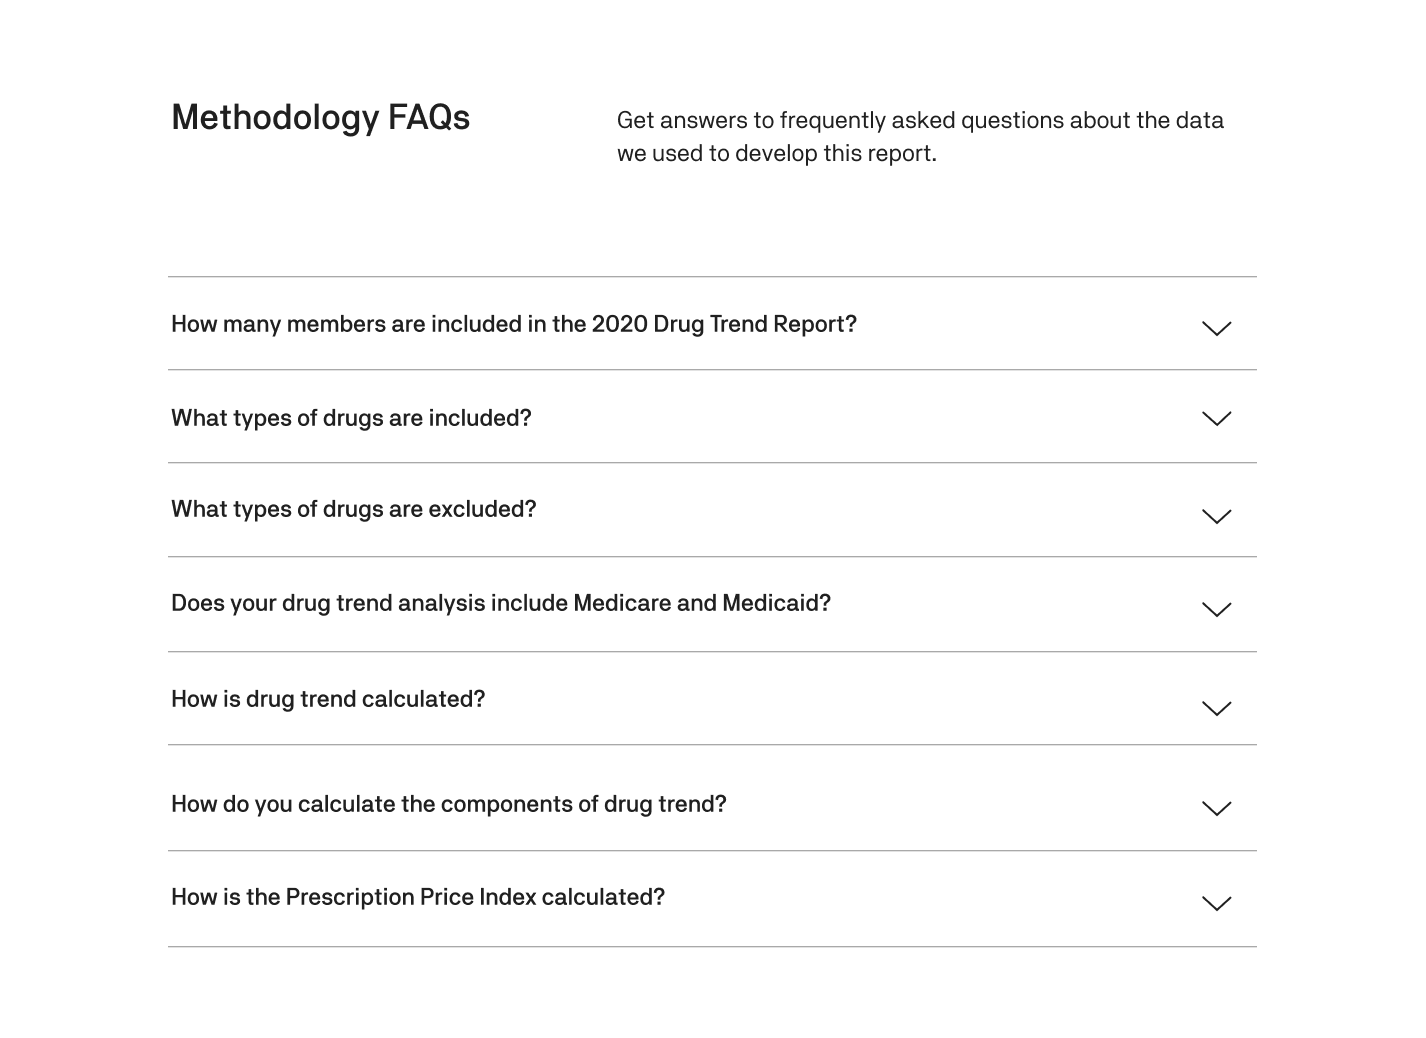
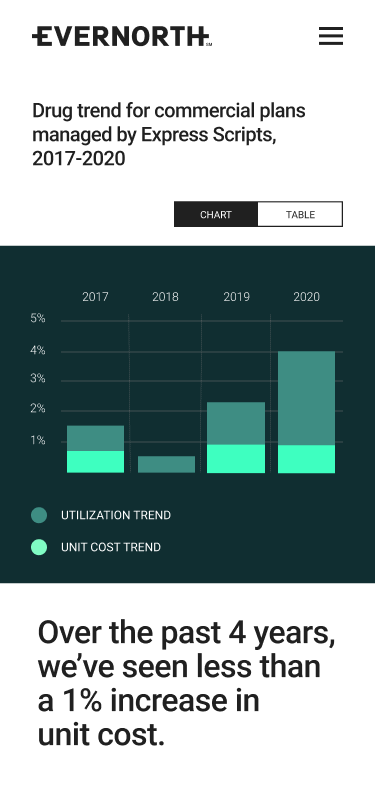
The design and layout was portal based so each section was essentially a chapter in the report. The data and visualization was an interaction that allowed for multiple views of the charts.

Mobile Adaptive
The strategy of using a portal approach for the report was that it scaled seemlessly to an accessible mobile responsive experience.
Utilizing the viewport on mobile devices allowed for the Evernorth brand experience to be front and center.
What worked
- Collaboration with cross-functional partners
- We addressed scalability concerns in Drupal
- Dev teams were able to build new templates and components from designed execution
What needs work
- Not all functionality was present for the report
- Time played a key factor, product was rushed
- Drug trends weren't available wehn designing the report
- Had to constantly reach out to business product stakeholders